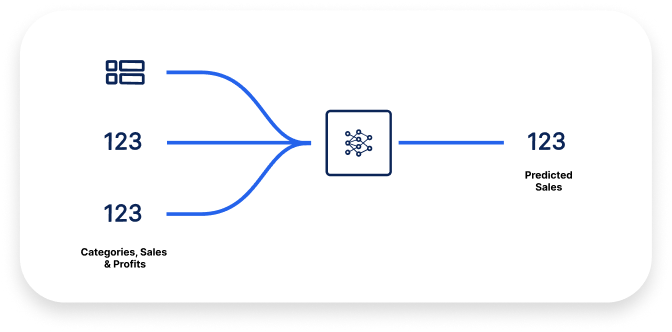
Business adaptability is crucial, especially in retail, where managing product storage and shelf life is complex. Demand forecasting aids in adjusting revenue predictions and sales forecasts, optimizing supply chain management for thousands of products across various locations. Use Simplismart and train your demand forecasting model for State of the Art results.
Running a business means we need to be flexible. We need to be able to adjust our revenue predictions, and sales forecasts as the environment around us change.
Retail online and offline businesses need help finding how much and where to store the product. This is a significant problem, primarily if you sell a product with a shelf life. Managing your supply chain becomes more challenging when dealing with thousands of SKUs and multiple geographies.
One of the methodologies that can help us do this is demand forecasting. It allows us to track our previous performance, forecast likely future performance and then use this forecast to adjust our operations. Demand forecasting is also critical in determining a company's capacity or production level. The demand forecast also helps in capacity planning and inventory management. Also, it helps in deciding the price of the product.
How to Build a System?
Demand forecasting is a complex and challenging task. It involves absorbing a lot of data which can be disparate, creating a coherent picture and translating that into actionable insight. Next, it consists of many integrations with other systems and often some manual intervention. An off-the-shelf no-code solution from a third party can be helpful here, but it will NOT be specific to your business and data. This blog will look at how to build a custom no-code solution specific to your situation.
In this article, we will go through the Iowa Liquor Forecasting Dataset, in which we will predict sales based on different parameters like date, city, store name, volumes of a bottle sold, state cost, category, etc. We will divide this article into two phases: Data Exploration and Data Preprocessing, Model Training, Metrics and Deployment using SimpliSmart.

Data Exploration
The dataset contains 4150780 rows and 18 columns, out of which 1 column, "Sale ($)", is a dependent variable. Here are some EDAs on the data, which help you understand different features of the data.


MLOps on SimpliSmart
In this section, we will explore uploading a Dataset, training a model, and deploying and evaluating the Performance of the model. Before heading to the tutorial, we suggest you read Introduction to SimpliSmart Platform and sign up so you can follow us along in the tutorial. Sign up today and get $50 of credits.
Uploading Dataset
- Let's start with uploading the dataset on SimpliSmart. Head over to Dataset Tab from the sidebar menu, click on Add Dataset, and fill in details like Name of Dataset and Description (Optional)

- Click on Next, and choose the source of the data frame, whether to upload from local storage or import from cloud storage. We will upload the data frame from local storage for this blog.

- Click on Upload a Dataframe; a dialogue box will open; choose the data frame, click finish, and wait until it is uploaded.
- Once it gets uploaded, wait for a maximum of 5 minutes to get all details of the dataset, like the size on disk and the snapshot of the dataset like below.

Model Training
- Click on Train Model, Add basic details like Name of Model and Description and click Next.

- Select the dataset on which you want to train the model, select the output and input columns, and click next.

- Select the Number of Experiments, Time Limit and Hardware to train your model and click Finish.

- You would see the job as running in the card. Click the card and get more details like configuration, experiments and metrics. As we can see, we achieved an R2 score of 0.93

- After it flags success, head to the model's section and click on deploy, once deployed, it will provide a Live Flag and click on the card.
- Click on Predict tab, where we have already provided 3 examples to try. Scroll down and click on "Predict".

- Click on Evaluation Tab to evaluate a dataset. Click on "Start Evaluation", select data, and click on start evaluation job. Wait for some time, and you will get the results.

Final Thoughts
So you see how quickly we have done 5 processes of the modern MLOps lifecycle without any code that provides SoTA results. The traditional method takes around 7 months for 4M Rows and 18 Columns. We have done this in less than 90 minutes.

When building a demand forecasting system, you should consider the following points:
- Clear and well-defined business requirements
- High-quality data
- Easy to use
- Cost-effective
- Efficient and accurate
- Customisable and flexible
Demand forecasting is a highly required and time-consuming task in any business. This is why many software solutions can help you automate the process, but not all are the right fit for your business. To successfully find the correct answer, you must carefully analyse the product, compare it to others and see if it meets your needs.


